Solar eclipse maps from 1801 to 1850

Sources
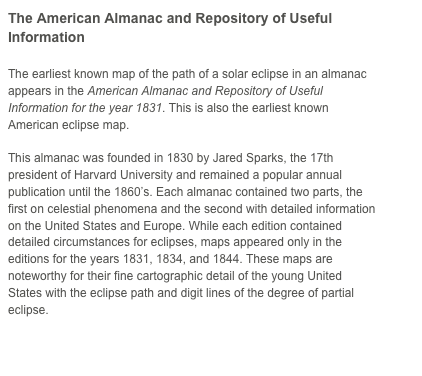
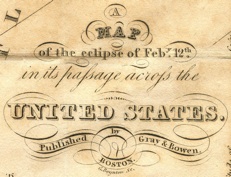
The maps from the American Almanac and Repository of Useful Information for the years 1831, 1834, and 1844 are from the collection of Michael Zeiler.
The maps from the British Nautical Almanac and Astronomical Ephemeris were scanned from the collection of U.C. Berkeley.
The eclipse map of 1846 by Johann Georg Heck is from the collection of Michael Zeiler.
The 1842 map by Jacob Lehman is from Die Sonnenfinsternis am 8. Juli 1842 found at http://www.e-rara.ch/astro-eth/
The 1842 maps by Curzio Buzzetti is from Ecclissi totale di sole visibli in gran parte dell’Europa found at http://www.e-rara.ch/astro-eth/
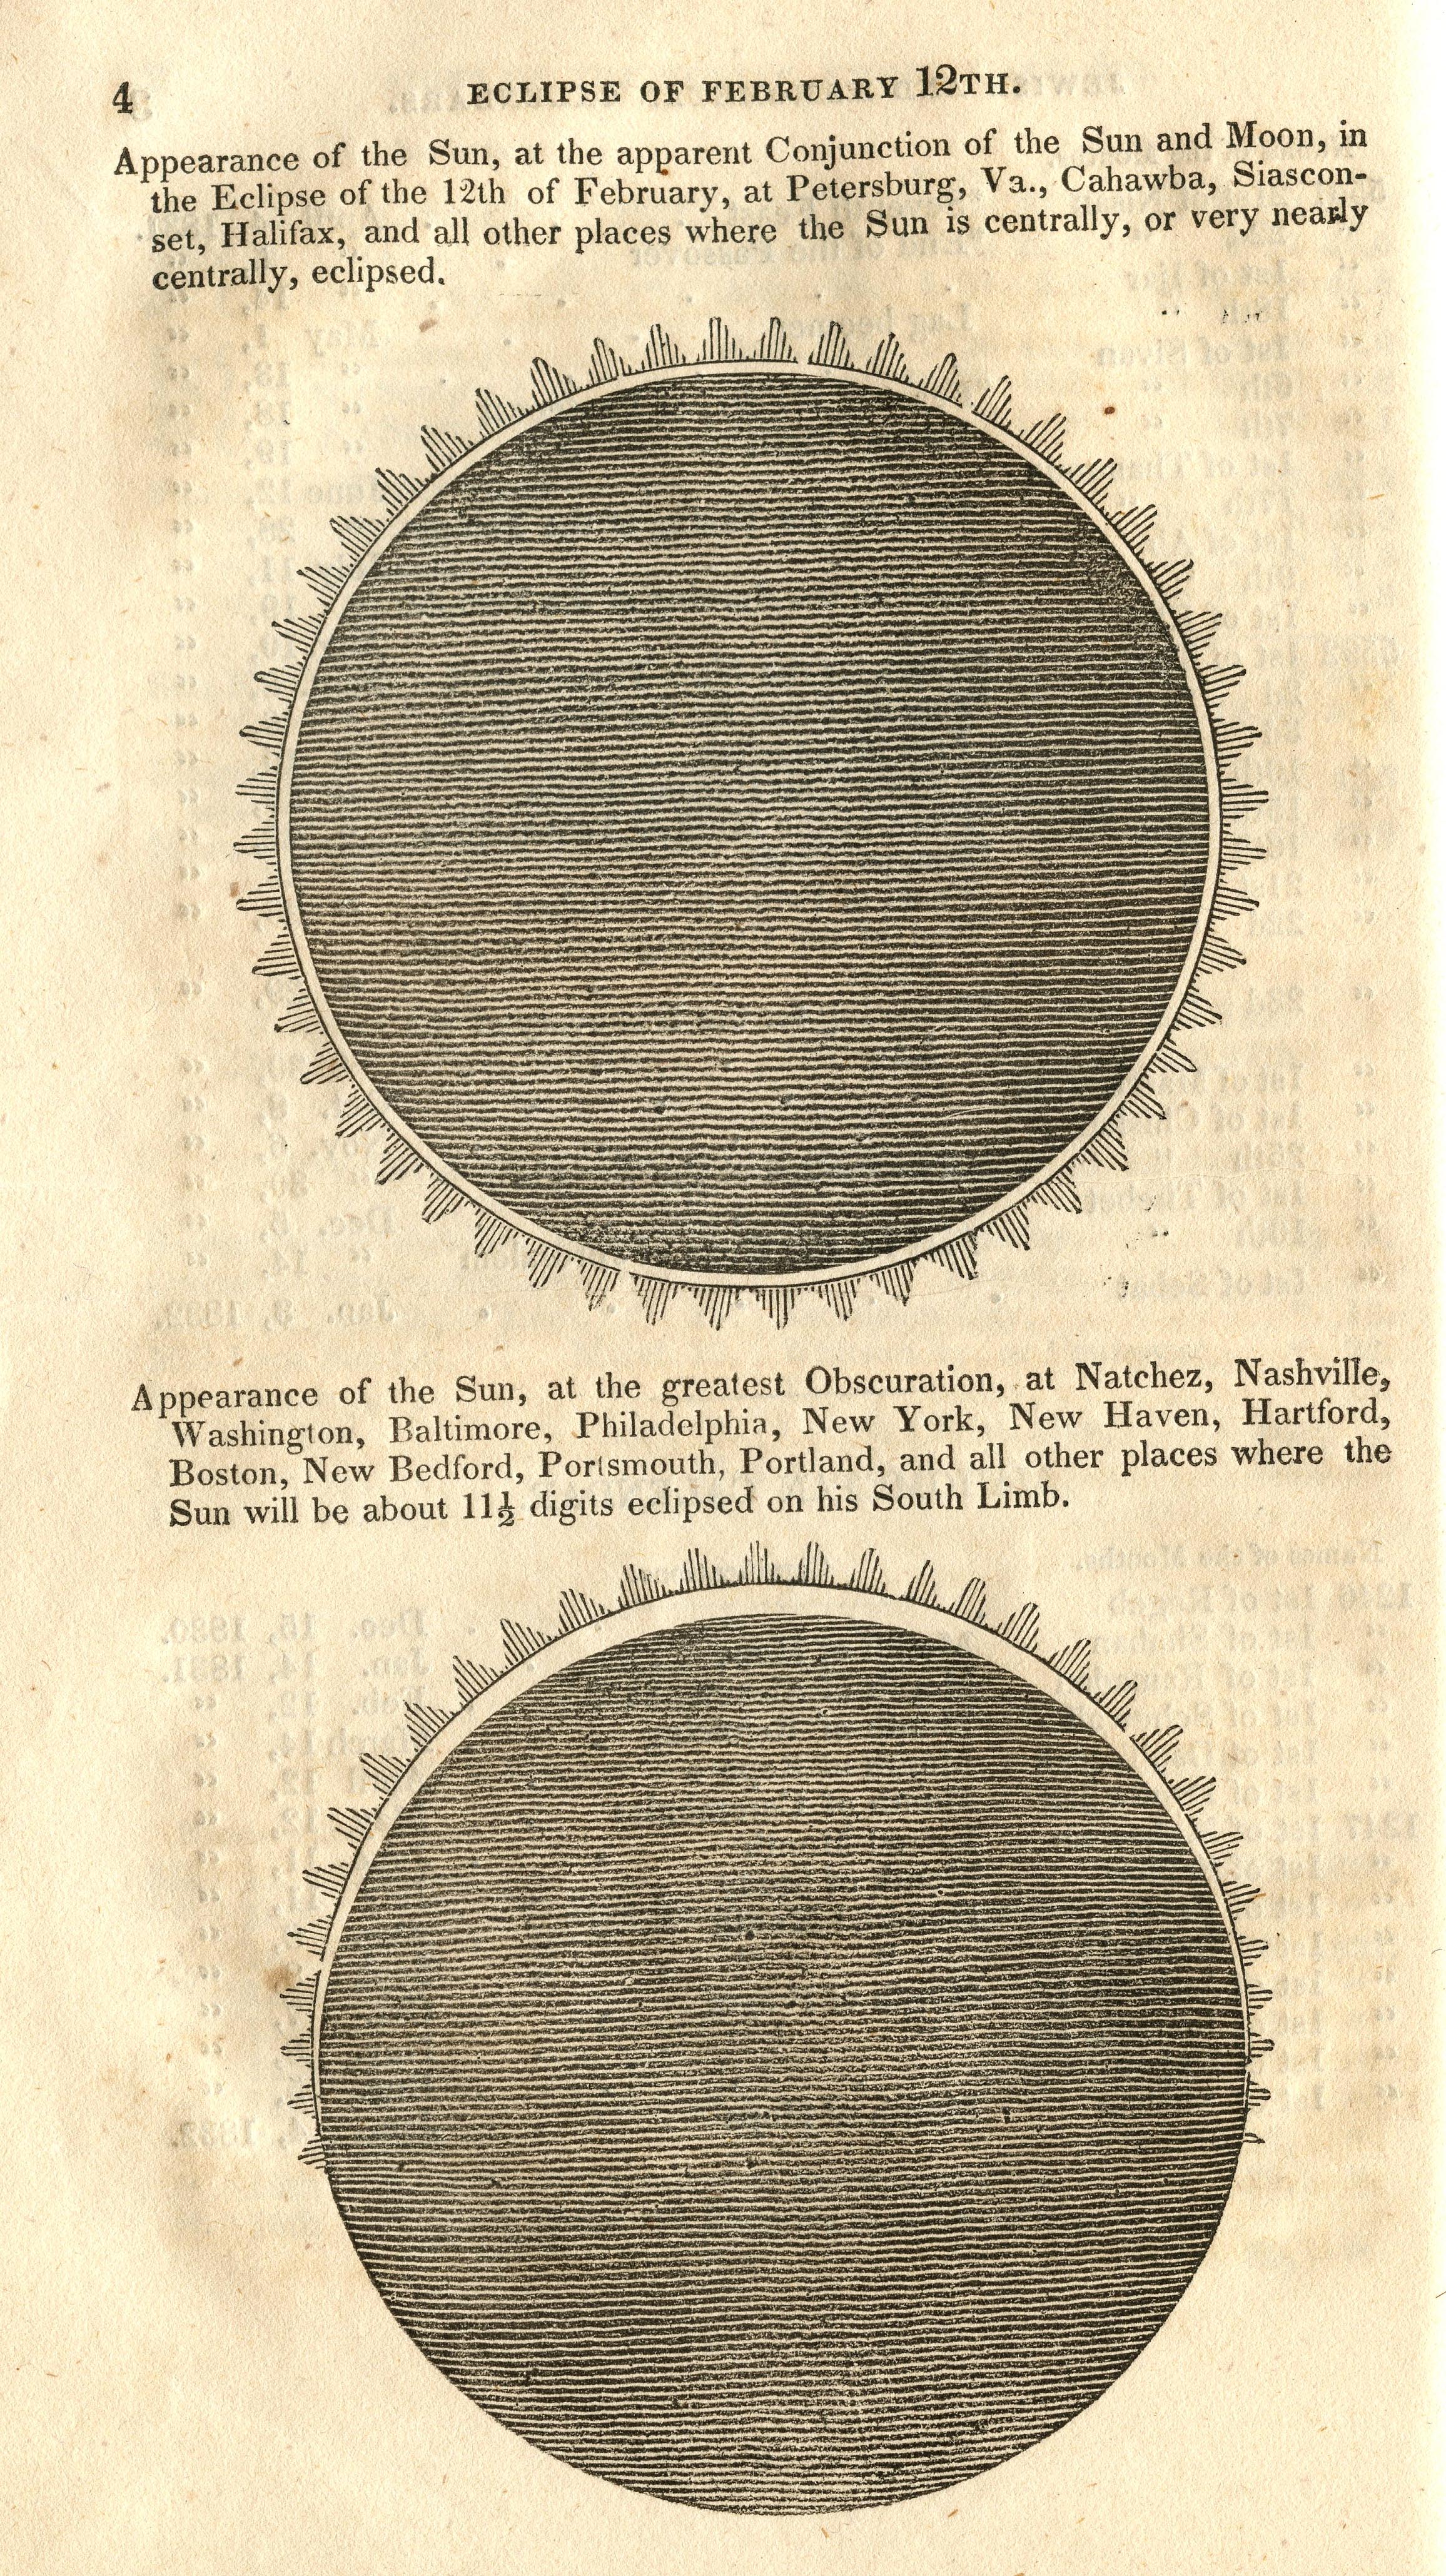
Page from the American Almanac and Repository of Useful Information for the year 1831 showing the appearance of the annular eclipse from places in the United States.
The top figure depicts the eclipse from or at near the central line of eclipse. The bottom figure depicts the eclipse where 11 1/2 digits of the sun are obscured. As discussed on the page for eclipses from 1654 to 1700, the term digits signifies the division of the sun’s diameter into 12 parts.
The use of 12 digits to describe the degree of eclipse dates from antiquity until the 19th century. The two last known maps to use this system are in the gallery below; the 1844 map from this same almanac and the 1846 map by Johann Georg Heck.
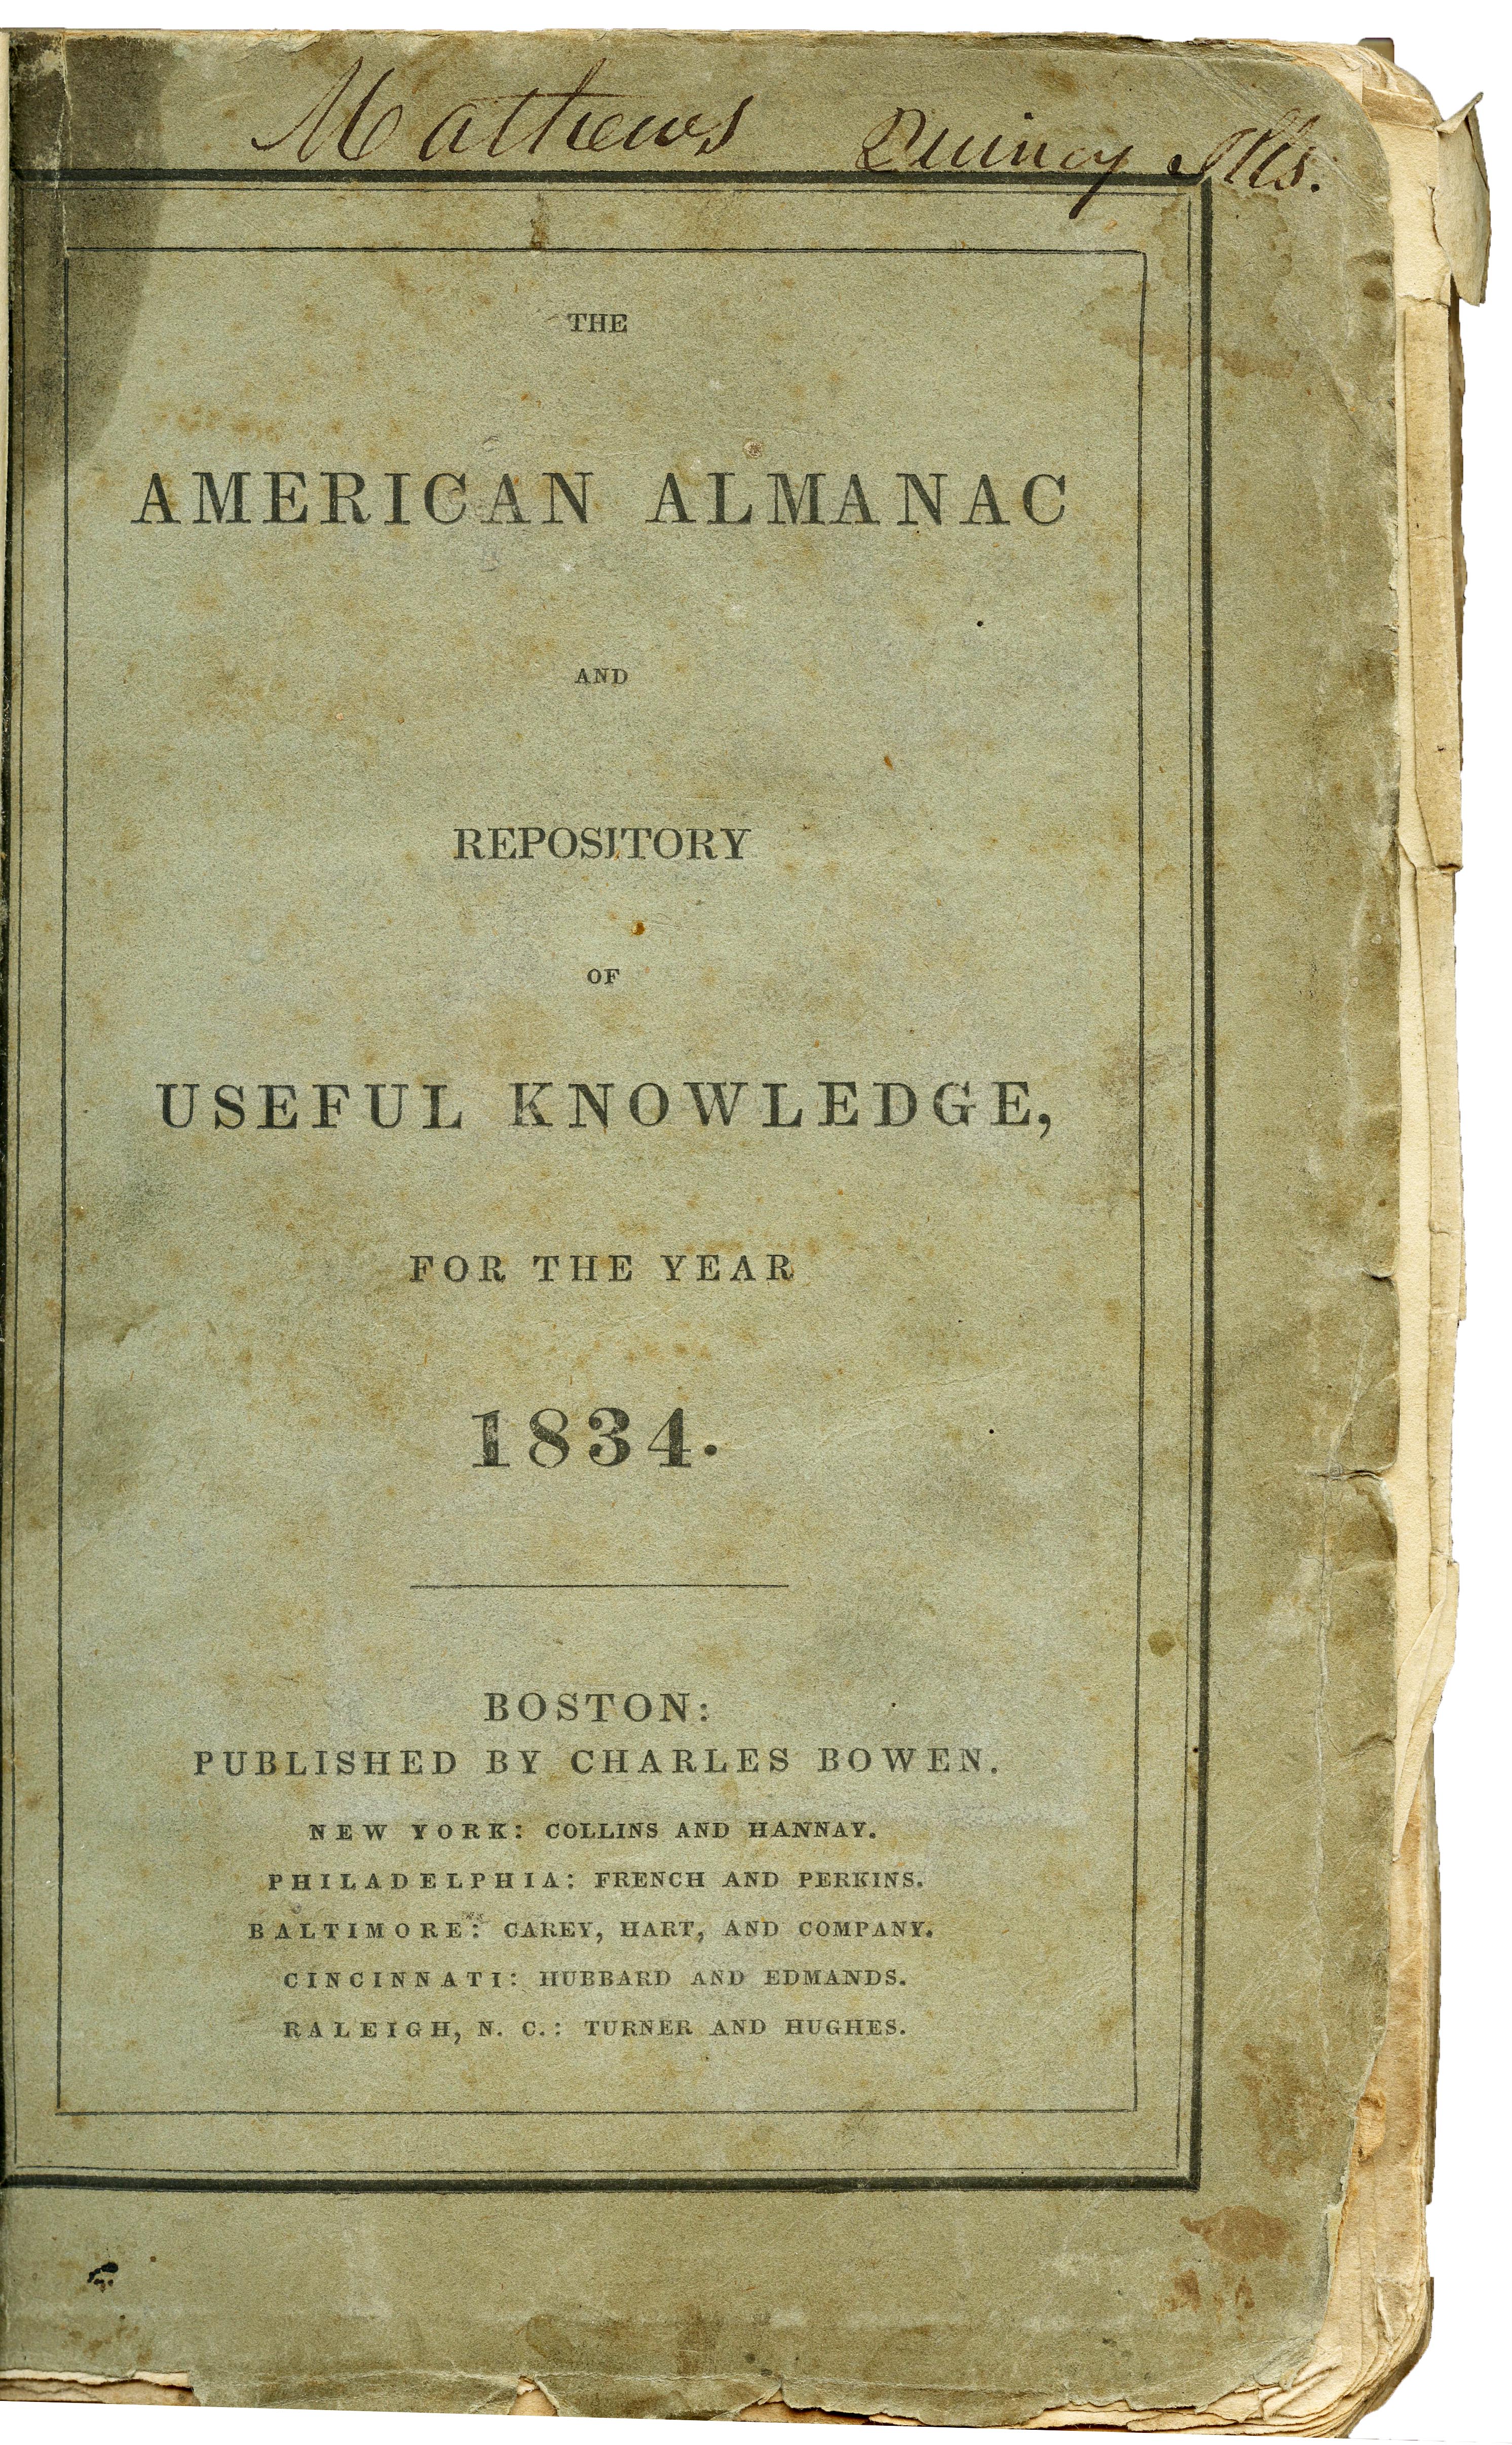
Cover and introduction pages from the American Almanac and Repository of Useful Information for the year 1834. To read the text, click on the images to view a larger version.

The British Nautical Almanac and Astronomical Ephemeris
The Nautical Almanac and Astronomical Ephemeris was first published in the year 1766 with data for 1767. The establishment of this almanac was motivated by the need to establish longitude at sea and contained tables of lunar distances to enable this reckoning.
A reorganization of the Nautical Almanac was undertaken for the year 1834 with the key enhancement being the adoption of Greenwich mean time for astronomical tables. In the report of the Almanac committee, several dozen recommendations for made for improvements including the establishment of eclipse maps, as detailed in point 23 reproduced below from the 1834 almanac.
Map title from the first almanac map of 1831.
Since 1834, eclipse maps have appeared in nearly every annual edition of the Nautical Almanac and Astronomical Ephemeris.
A notable characteristic of the early eclipse maps in the Nautical Almanac is their application of map projection. For eclipses in the mid-latitudes, the Mercator projection was used and the stereographic projection was used for eclipses that span the polar regions.
Today, cartographers consider the Mercator projection to be a poor choice for world maps because of the severe distortion in the polar regions. Greenland appears to contain the same area as Africa whereas it has about one-seventh the land mass. In fact, the poles cannot be mapped at all because they are an infinite distance from the equator in the Mercator projection. Other map projections are preferred today for global maps, most notably the Mollweide, Robinson, and Winkel-Tripel projections.
However, the use of the Mercator projection can be understood within the Nautical Almanac because this projection has a special property for navigation: A straight line drawn on a map with Mercator projection defines a rhumb line, which is a line of constant bearing. A sailor can follow this constant bearing to easily navigate from one port to another.
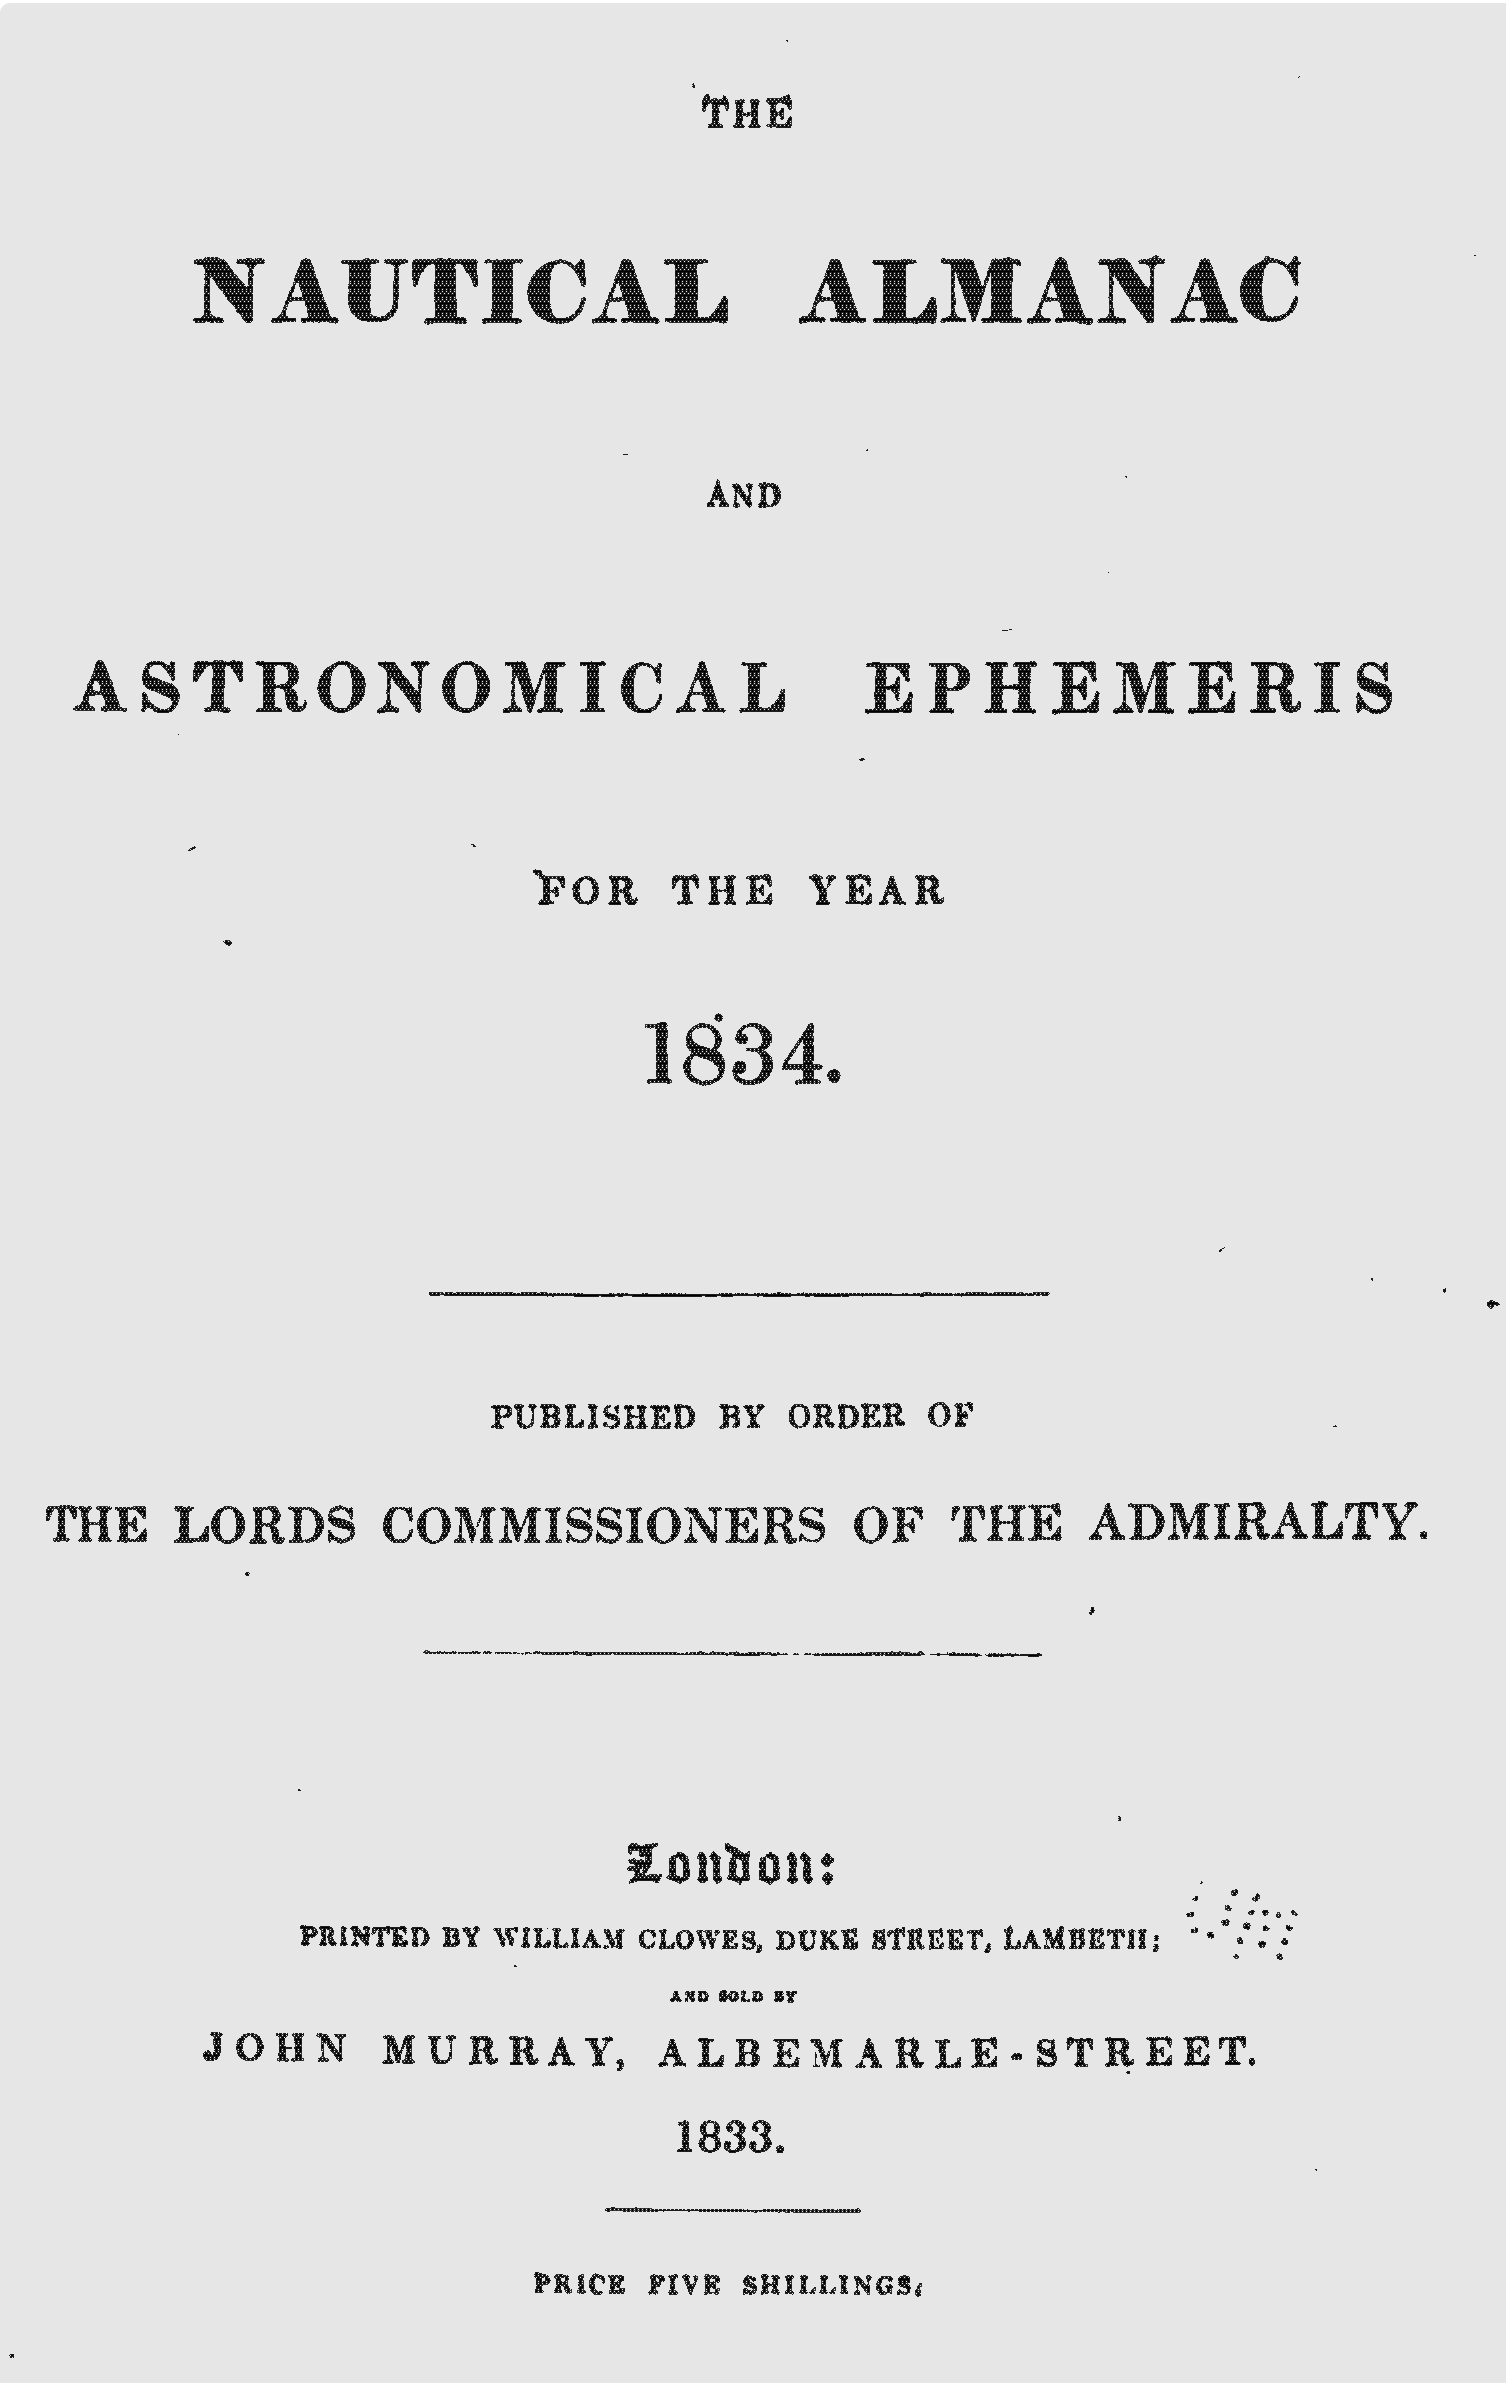
Title page of the Nautical Almanac and Astronomical Ephemeris for the year 1834.
Generally, eclipse maps in this almanac were drawn for the entire penumbral path of a solar eclipse. For eclipses which passed over the United Kingdom, detail maps are provided, such as shown in the maps from 1836 below.
