While solar eclipses were well understood in antiquity and correct diagrams of eclipses were made from the time of Claudius Ptolemy and earlier, it was not until the Age of Enlightenment when the earliest maps of the actual path of an eclipse on earth appeared.


The emergence of eclipse maps represents the convergence of several advances in scientific thought -- the heliocentric model developed by Nicolaus Copernicus, Johann Kepler’s laws of planetary motions developed from Tycho Brahe’s measurements, and new geographic knowledge spanning the old and the new world with a system of longitude and latitude values.


The earliest known map of a solar eclipse


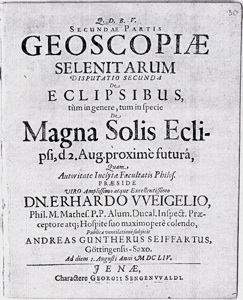
The earliest known solar eclipse map was created in 1654 as part of an academic disputation involving Erhard Weigel, professor, and Andreas Gunther Seiffart, student, on the subject of the astronomical theory of eclipses. (An academic disputation is a formal system of debate to establish the truth of a theory based on accepted sources and logic). The map was engraved by Johann Dürr. The calculations made by Weigel and Seiffert were based on the Rudolphine Tables of orbital elements calculated by Kepler.


Erhard Weigel (1625-1699) was a German mathematician and astronomer in Jena (http://en.wikipedia.org/wiki/Erhard_weigel) and played an important role as an advocate for calendar reform in Germany. He also instructed Gottfried Wilhelm Liebniz, one of the inventors of the calculus, at Jena University.


Another early eclipse map from Germany


In 1676, Johann Christoph Sturm (1635-1703), professor of astronomy, mathematics, and physics at Altdorf University, published an 34-page almanac called the Finsternissen-Kalendar.


In a similar fashion to the first eclipse map by Erhard Weigel, the eclipse is depicted as a series of circles representing the penumbral shadow of the moon, but this map more accurately maps the eclipse as a curved path of eclipse instead of a straight line.


Eclipse maps by Cassini


Another early innovator of early eclipse maps was Giovanni-Dominico Cassini (1625-1712). Cassini seems to have constructed an eclipse map in the 1660’s but this map has not been found.


In 1700, Cassini published a retrospective map of the eclipse of 1699 September 23. This was the most accurate eclipse map up to this date and begins to resemble modern eclipse maps.


An important feature of this map is the introduction of isomagnitudes (lines of equal maximum eclipse) in solar eclipse maps. In this era, the obscuration of the sun by the moon during an eclipse was measured in parts of 12 and called digits (doigts in French). This map contains curves labelled “6 doigts”, or 6/12th maximum eclipse, “5 doigts”, or 5/12th maximum eclipse, and “12 doigts”, the path of the total solar eclipse.


This convention of dividing the maximum eclipse into intervals of twelve “digits” began in antiquity and endured well into the 19th century and appears in maps from Germany, England, France, the Netherlands, Czech Republic, and the United States. The last examples I can find are in the American 1844 map by Williams and the German 1846 map by Heck.


Today, isomagnitudes on eclipse maps are expressed in decimal intervals, typically 10% or 20%, sometimes even 1%. This might be related to the trend towards the widespread (except in the United States) adoption of the metric system in the 19th century.

This is the earliest known solar eclipse map. According to German historian of science Klaus-Dieter Herbst, this map of the total solar eclipse of August 12, 1654 was published by Erhard Weigel on the day before the eclipse! On the right is a reconstruction of the map using modern eclipse calculations and geographic information system software. The map applies an orthographic projection from the moon’s perspective at the time of greatest eclipse.


The circles represent the shadow of the moon (penumbra) and the path of the total solar eclipse is the line annotated as “Via Umbra Luna”. A curious feature of this map is that the path of the eclipse is shown as a straight line instead of the sweeping arc which results from the combined motion of the moon’s shadow and the earth’s rotation about a tilted axis. This map can be best understood as a snapshot of the view of the earth during the middle of eclipse. While it’s difficult to judge whether the greater error is in the geographic positions of continents or in the eclipse calculations, the reconstructed map on the right shows that Weigel’s map is a credible depiction of this total solar eclipse.

Solar eclipse maps from 1654 to 1700

The earliest eclipse maps

This eclipse map is also from Jena, Germany and was developed by Johann Christoph Sturm. This map portrays two solar eclipses of 1676, the annular solar eclipse of June 11 (top) and the total solar eclipse of December 5.


Both eclipses are engraved using a stereographic projection centered on the meridian of the the point of greatest eclipse. As with the first eclipse map by Erhard Weigel, the shadow of the moon is depicted as a series of penumbral circles, but this map more accurately shows how the eclipse progresses along an arc (instead of a straight line). Again, it’s difficult to judge the relative errors in eclipse prediction versus geographic accuracy, but the GIS reconstruction on the right demonstrates  that Sturm’s map is generally correct. Antarctica was undiscovered at the time and the austral region was imagined as a massive “Terra Incognata”.

Sources


The first eclipse map of 1654 by Weigel and historical information was provided by communication with Klaus-Dieter Herbst of Jena, Germany. Herbst recently uncovered this map and described it in his recent book published in 2010, Die Schreibkalender im Kontext der Frühaufklärung (The almanac in the context of the Enlightenment).


I was made aware of Sturm’s double-eclipse map of 1676 by Klaus-Dieter Hersbt of Jena, Germany. The original document in which this map appears can be found at

http://zs.thulb.uni-jena.de/servlets/MCRFileNodeServlet/jportal_derivate_00203108/K_1676_6b.pdf

Another eclipse calendar by Sturm does not contain maps but an intriguing illustration on the front page: http://zs.thulb.uni-jena.de/servlets/MCRFileNodeServlet/jportal_derivate_00200108/K_1676_6a.pdf


The research on the eclipse maps by Cassini was provided by Robert van Gent. See http://www.phys.uu.nl/~vgent/publications/eclipse_maps.pdf. Cassini’s retrospective map of 1700 appears in the Histoire de l’Académie Royale des Sciences avec les mémoires de mathématique & de physique tirez des registres de cette Académie pour l’année MDCXCIX (Paris, 1700).


Regarding Cassini’s missing eclipse map, van Gent quotes Otto Neugebauer from A History of Ancient Mathematical Astronomy, 1975, page 1093: “The idea of investigating the total path of a solar eclipse [...] is of modern origin –probably developed in the time of J.Cassini under the influence of the great theoretical interest of the Venus transits of 1761 and 1769. […] According to Lalande (Astron.II, p.358, No.1799; Bibl., p.256, 1644 [read 1664]) Dom. Cassini constructed in 1664 for the first time the path of a solar eclipse (visible in Ferrara) on a terrestrial map. But there was no total solar eclipse in 1664 and no publication of Cassini with the title quoted by Lalande seems to be known.”