The Five Millennium Catalog of Solar Eclipses by Fred Espenak and Jean Meeus is a comprehensive survey of eclipses from the years -1999 to 3000. The digital publication of this catalog can be found at http://eclipse.gsfc.nasa.gov/SEpubs/5MCSE.html


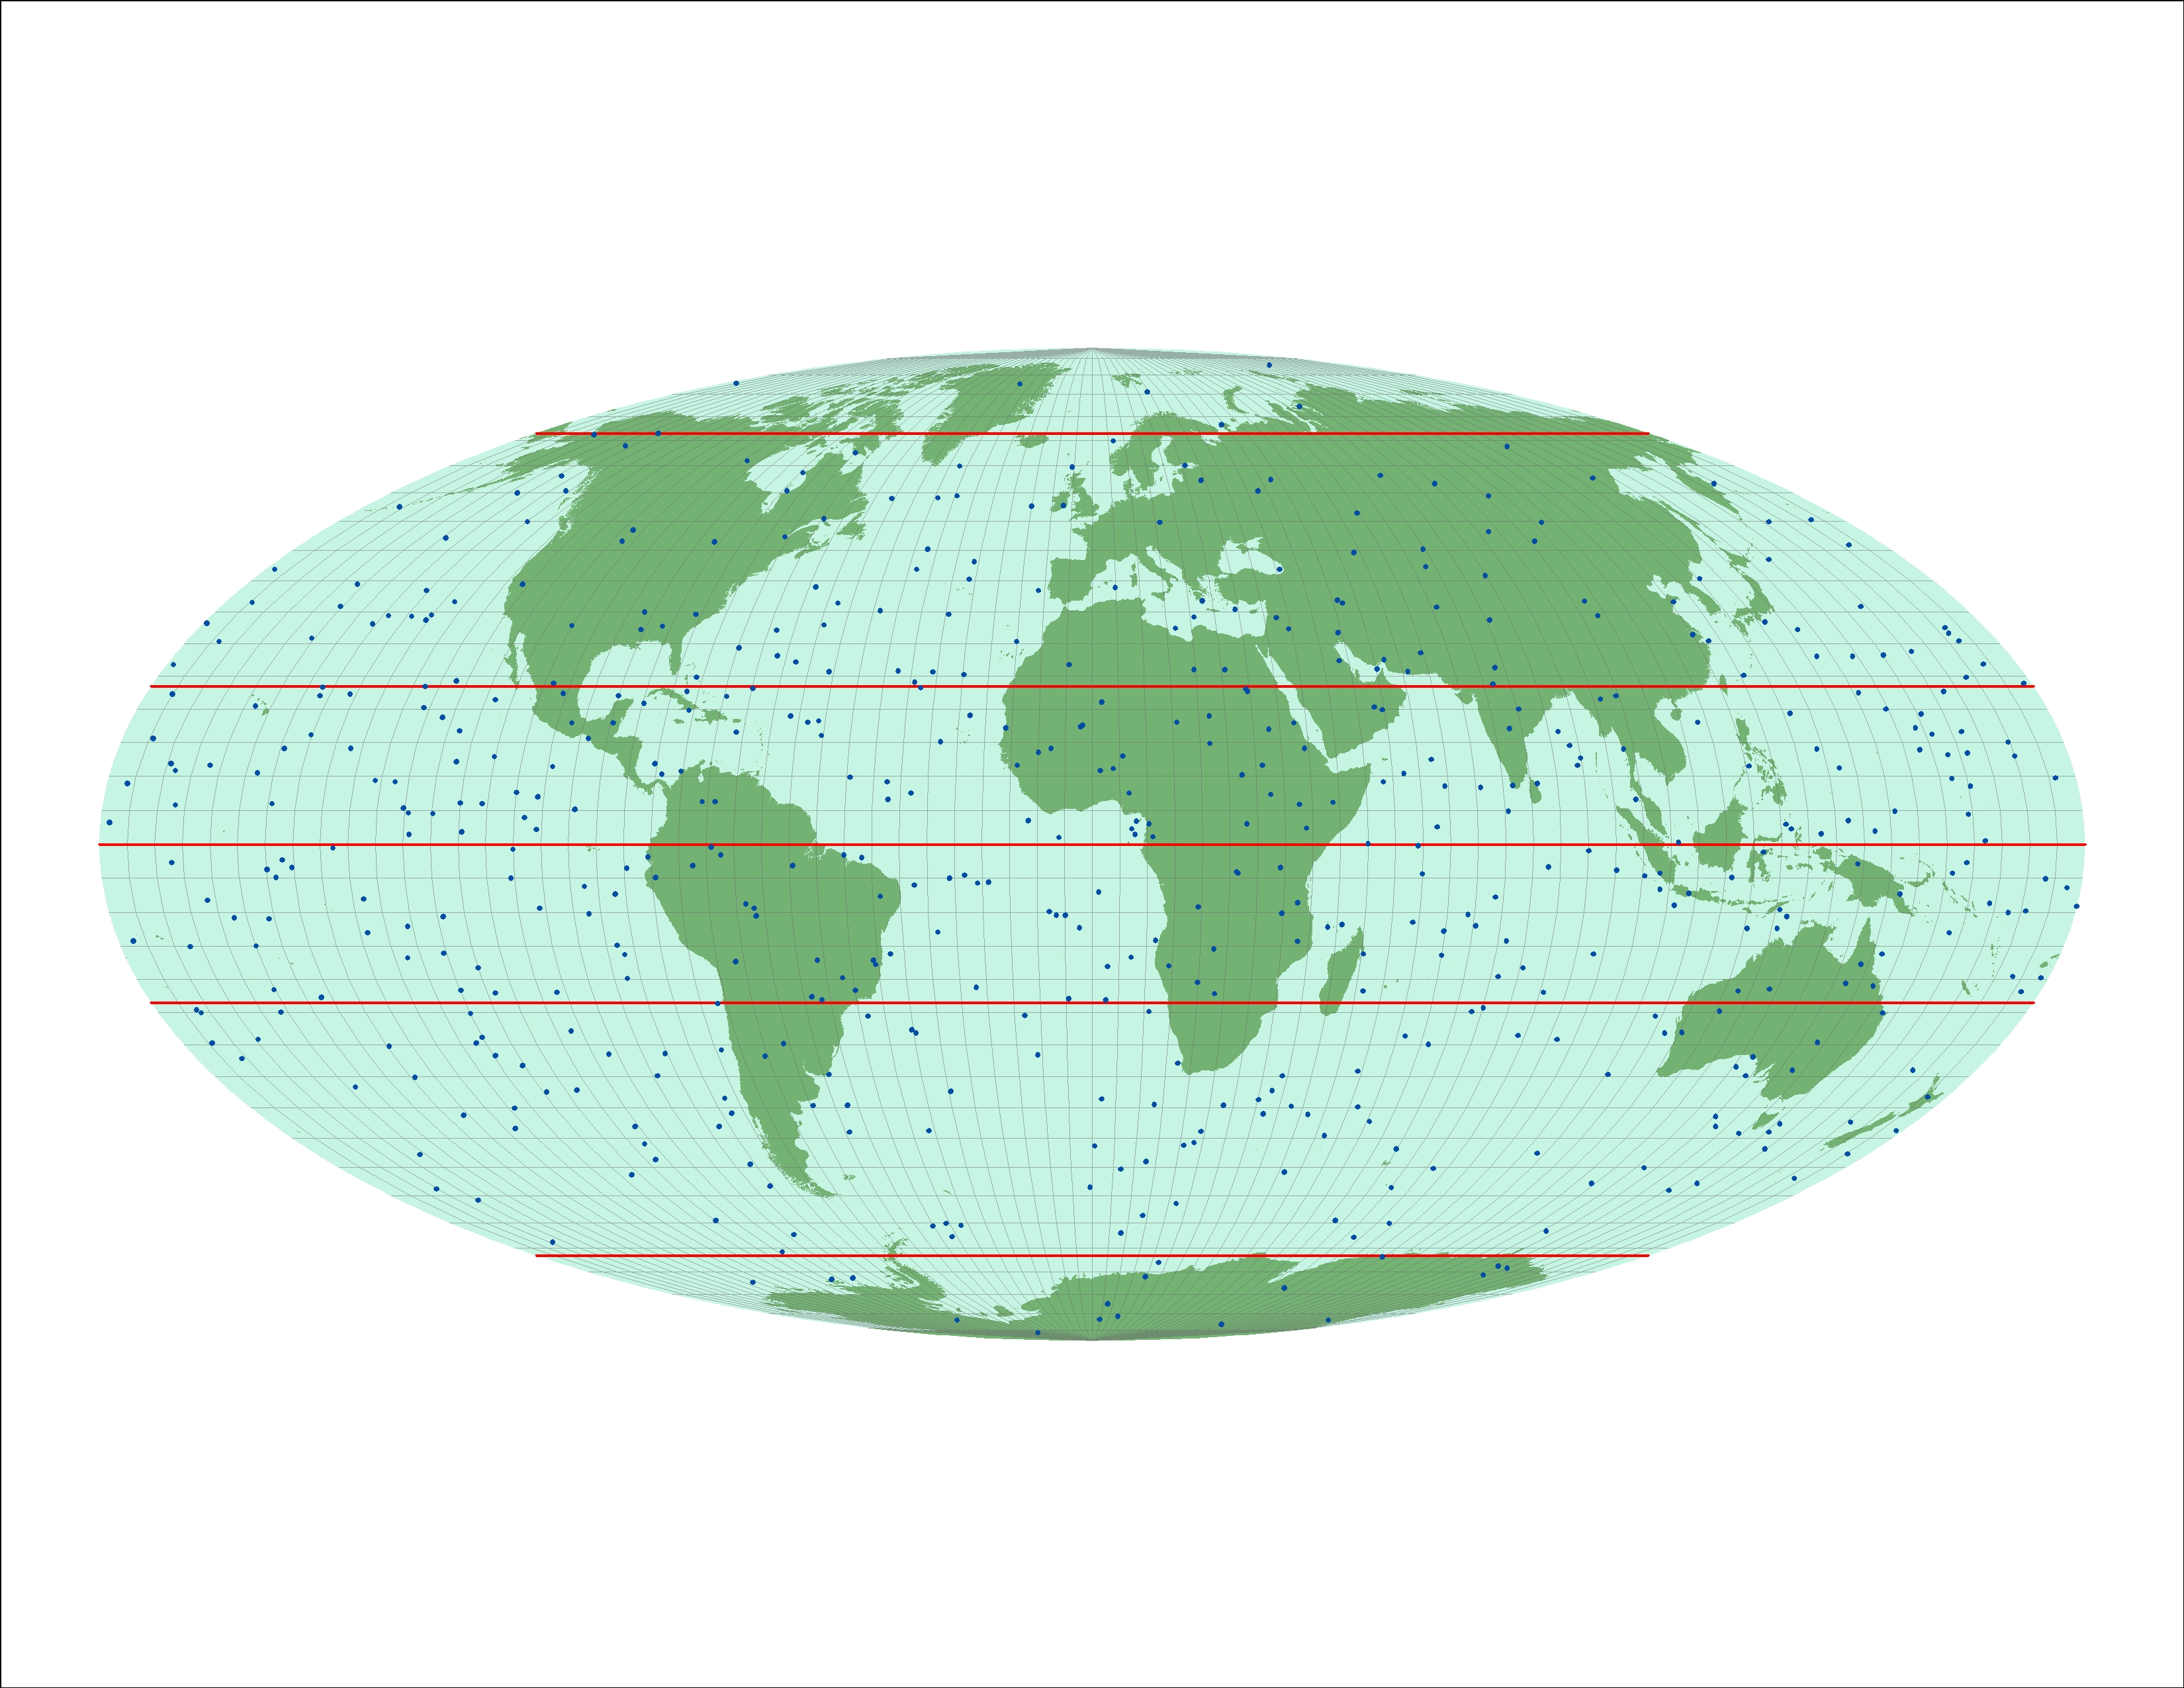
A summary table listing key attributes of this catalog is at http://eclipse.gsfc.nasa.gov/5MCSE/5MCSEcatalog.txt. This table contains spatial data in the form of latitudes and longitudes for the points of greatest eclipses of all eclipses in the span of five millennium. Because I work in the GIS industry, my first instinct is to map that data and see if any spatial patterns can be discerned. An apparent pattern is indeed present, but only for partial solar eclipses.


The red lines on these maps are the Arctic Circle, Tropic of Cancer, Equator, Tropic of Capricorn, and the Antarctic Circle. The graticule (lines of latitude and longitude) is shown at 5 degree intervals. The points of greatest eclipse are blue dots.


Click on any of the maps to view them in high-resolution.


Spatial distribution of points of greatest eclipse for all types of eclipses

Spatial distribution of points of greatest eclipse for total solar eclipses

Spatial distribution of points of greatest eclipse for annular solar eclipses

Spatial distribution of points of greatest eclipse for hybrid solar eclipses

Spatial distribution of points of greatest eclipse for partial solar eclipses

For partial solar eclipses, there is a very distinct segregation of points of greatest eclipses around the polar circles. When the latitudes of all these points are sorted in a table, they occupy the exclusive range of -72.3 to -60.5 degrees and 72.3 to 60.5 degrees. (The points in the table at http://eclipse.gsfc.nasa.gov/5MCSE/5MCSEcatalog.txt are given with a resolution of 0.1 degrees)


The average latitude of these ranges are 66.4 degrees, north and south. The latitudes of the Arctic Circle and Antarctic Circle are 66.5622 degrees, north and south. So this is a close but not precise match. Perhaps this difference is due to fluctuation of the Earth’s axial tilt over the five millennium.


What explains the width of the latitude band for points of greatest eclipse? Most likely it has to do with the inclination of the moon’s orbit, which has a mean value of 5.14 degrees, but also varies.


So how is this range of latitudinal values explained? Give the spatial distribution, the factors involved seem to be the latitude of the polar circles combined with the inclination of the moon’s orbit, and how the polar circles and orbital inclination have progressed over five millennium. I would be interested to learn of a clear explanation of this distribution of points of greatest eclipse for partial eclipses.